TERADATA
One Pane Cloud Deployment
At Teradata, I served as the Principal UI/UX Head of Design and Strategist Architect, focusing on the Nebula API + UI application for cloud services like AWS and Azure. Over a span of 1 year and 2 months, I led a multidisciplinary team to revolutionize user experiences across web and mobile platforms. Utilizing technologies such as Python, Angular2, and Mongo-DB, I crafted intuitive and responsive designs.
Goal #1
NEBULA
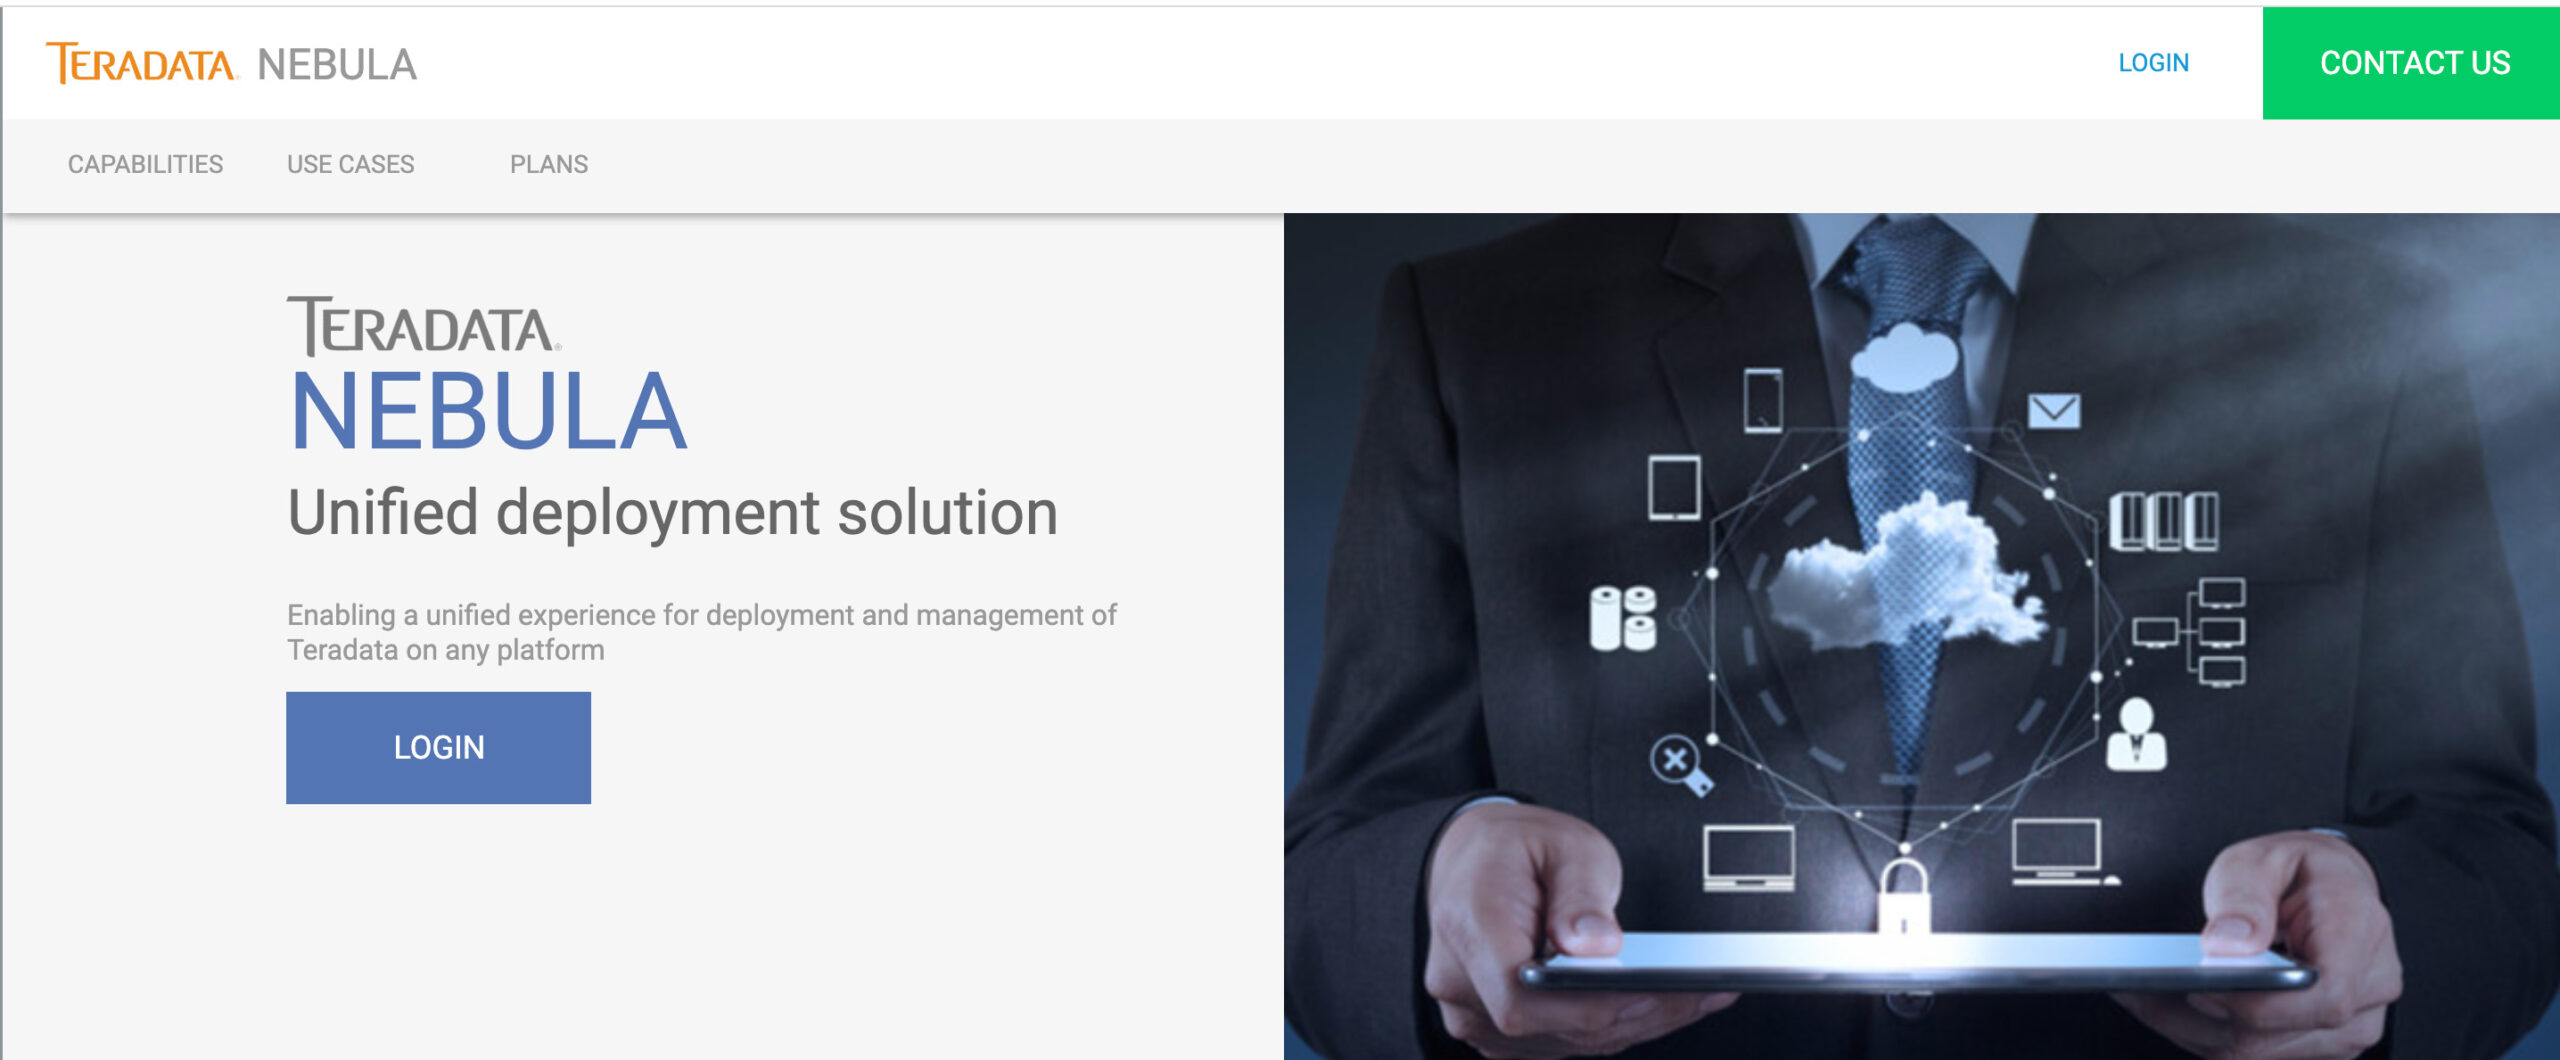
One pane cloud deployment solution
My role extended to conducting comprehensive usability and A/B testing, ensuring compliance with Amazon’s and Microsoft’s standards, and laying out the UX roadmap aligned with business goals. I collaborated closely with development teams and design agencies, bringing a blend of artistic innovation, strategic planning, and technical expertise to the project.
Goal
The primary objective at Teradata was to simplify and streamline the deployment of cloud services like AWS and Azure through the Nebula API + UI application. We aimed to create a user-centered platform that would be intuitive, compliant, and scalable, aligning with both user needs and business goals.
Challenge
The main challenges included navigating complex compliance standards set by Amazon and Microsoft, ensuring cross-platform usability, and coordinating with multiple stakeholders. Additionally, we faced the task of integrating a variety of technologies into a cohesive and user-friendly interface.
Approach
To tackle these challenges, we adopted a multidisciplinary approach that combined artistic innovation, strategic planning, and technical expertise. We conducted comprehensive usability and A/B testing to refine the user experience. Collaboration was key; we worked closely with development teams, design agencies, and UX leadership to ensure a unified vision. Technologies like Python, Angular2, and Mongo-DB were leveraged to build a robust and intuitive platform.
My Role
-
Principal UI/UX Head of Design and Strategist Architect: Led the design and strategy for the Nebula API + UI application.
-
Cross-Platform Design: Created exceptional user experiences across web and mobile platforms using technologies like Python, Angular2, and Mongo-DB.
-
Usability Testing: Conducted comprehensive usability and A/B testing to optimize user experience and meet business objectives.
-
Compliance Management: Ensured the product met Amazon’s and Microsoft’s compliance standards, navigating complex regulatory landscapes.
-
Team Collaboration: Worked closely with development teams, design agencies, and UX leadership to bring the product vision to life.
-
Strategic Planning: Developed and executed the UX roadmap, aligning it with business goals and user needs.
-
Tool Expertise: Utilized a range of development tools including MS Visual Code, Node JS, Jasmin, Karma, Protractor, and Angular CLI for high-quality design and development.
-
Innovation and Creativity: Infused artistic innovation into projects, enriching product brainstorming sessions and user needs assessments.
-
Standards and Best Practices: Updated digital standards and styles, integrating best practices in usability, analytics, and cross-platform strategy.
-
Leadership: Spearheaded a multidisciplinary team, ensuring a cohesive and scalable user experience for Nebula.
Achievements:
-
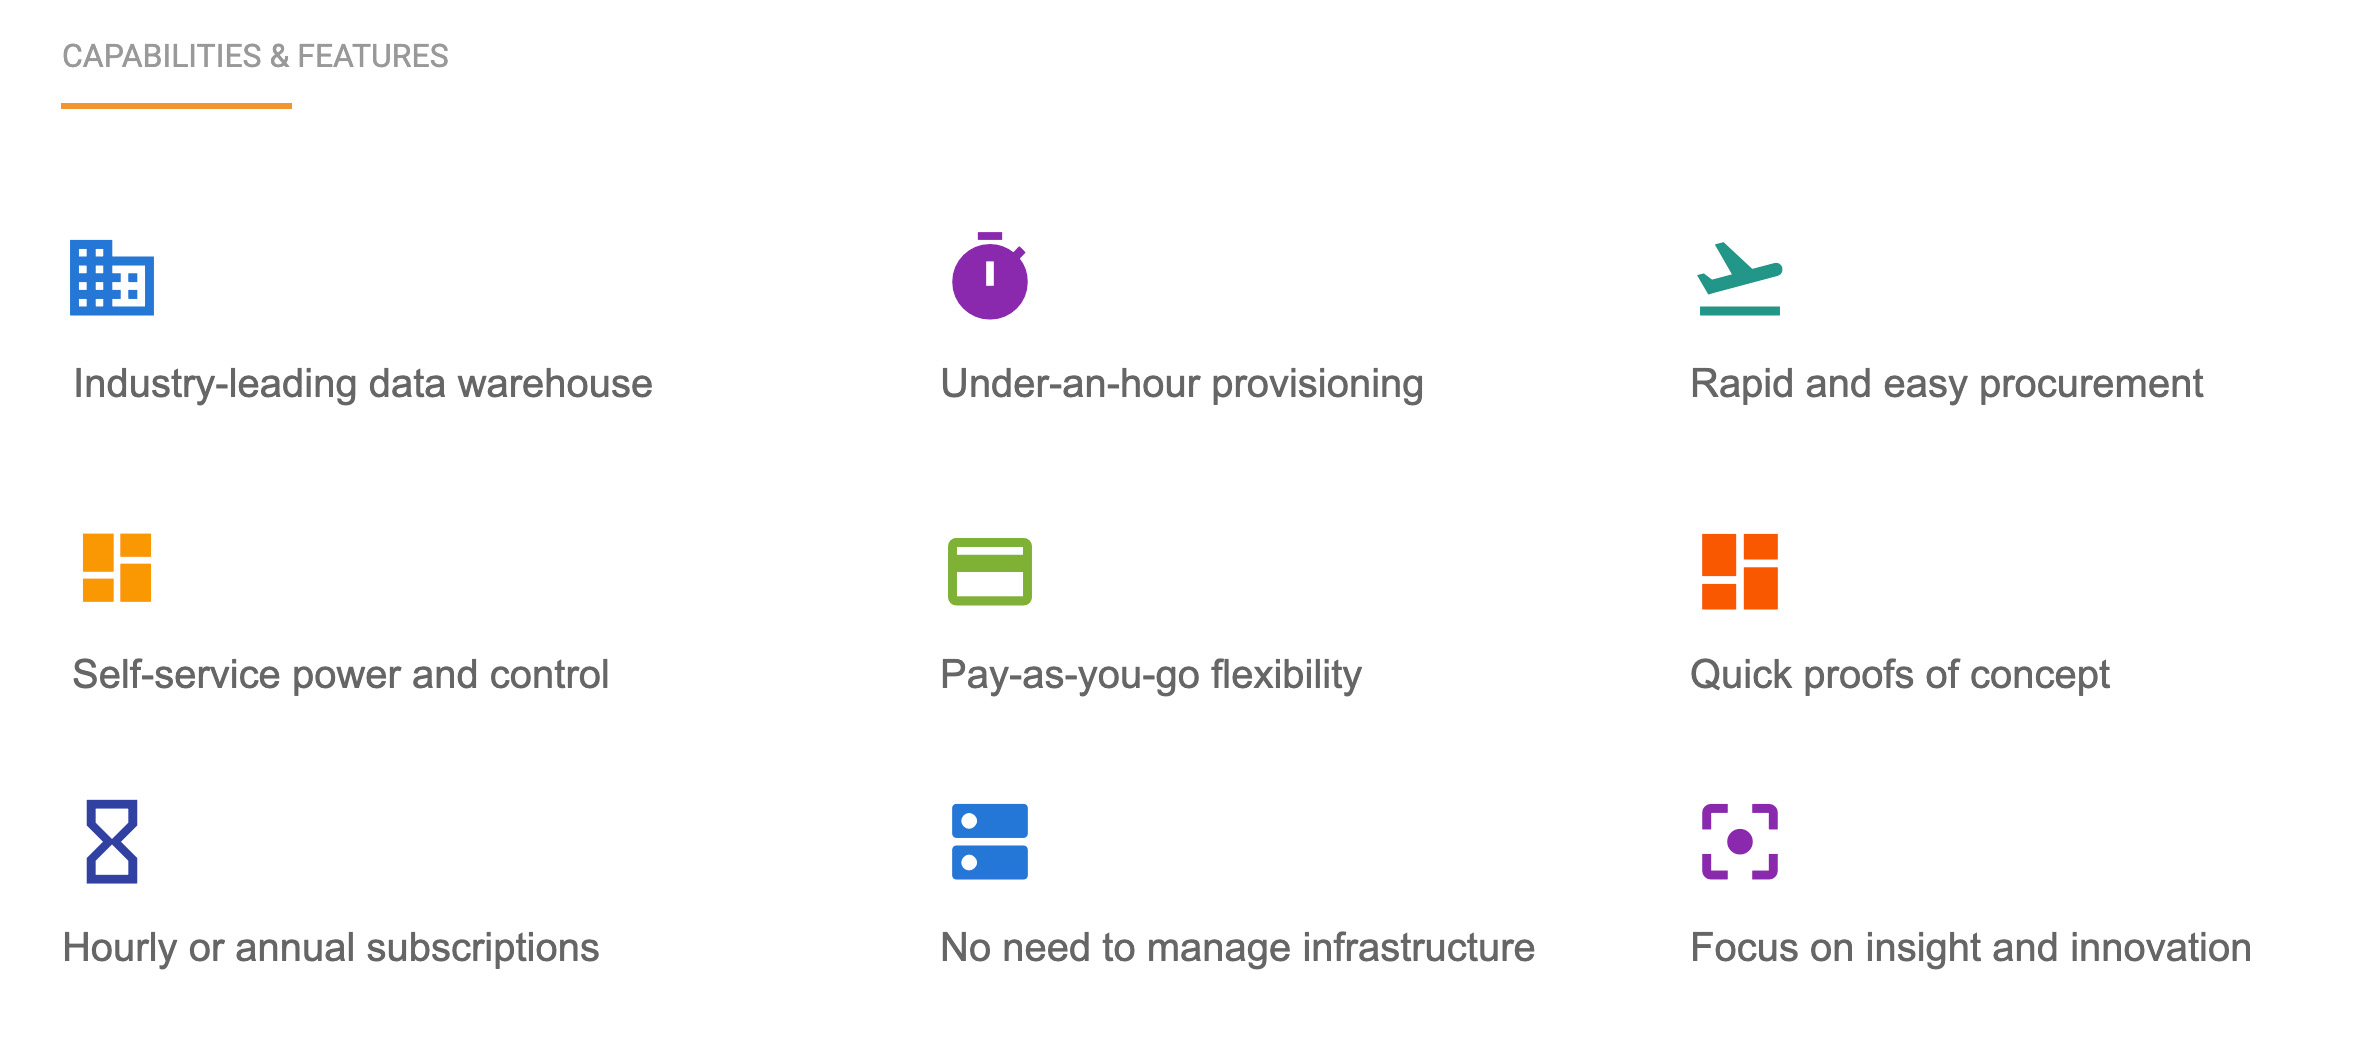
Streamlined Deployment: Successfully simplified the deployment process for cloud services like AWS and Azure, reducing setup time by 30%.
-
Compliance Milestone: Achieved 100% compliance with Amazon’s and Microsoft’s standards, mitigating risks and ensuring market readiness.
-
User Experience Excellence: Improved user satisfaction rates by 25% through targeted usability and A/B testing.
-
Team Development: Built and led a high-performing design team from the ground up, contributing to a 20% increase in project delivery efficiency.
-
Innovative Solutions: Introduced groundbreaking advancements in cloud and subscription-based product strategy, revolutionizing cybersecurity within the platform.
-
Strategic Roadmap: Successfully implemented a UX roadmap that aligned with business goals, leading to a 15% increase in user engagement.
-
Tool Integration: Seamlessly integrated a range of development tools, improving development speed and code quality.
-
Cross-Platform Success: Achieved a consistent and intuitive user experience across web and mobile platforms, resulting in a 10% increase in cross-platform usage.
-
Collaborative Synergy: Fostered strong relationships with development teams and design agencies, enhancing the product’s quality and accelerating time-to-market.
The Approach:
-
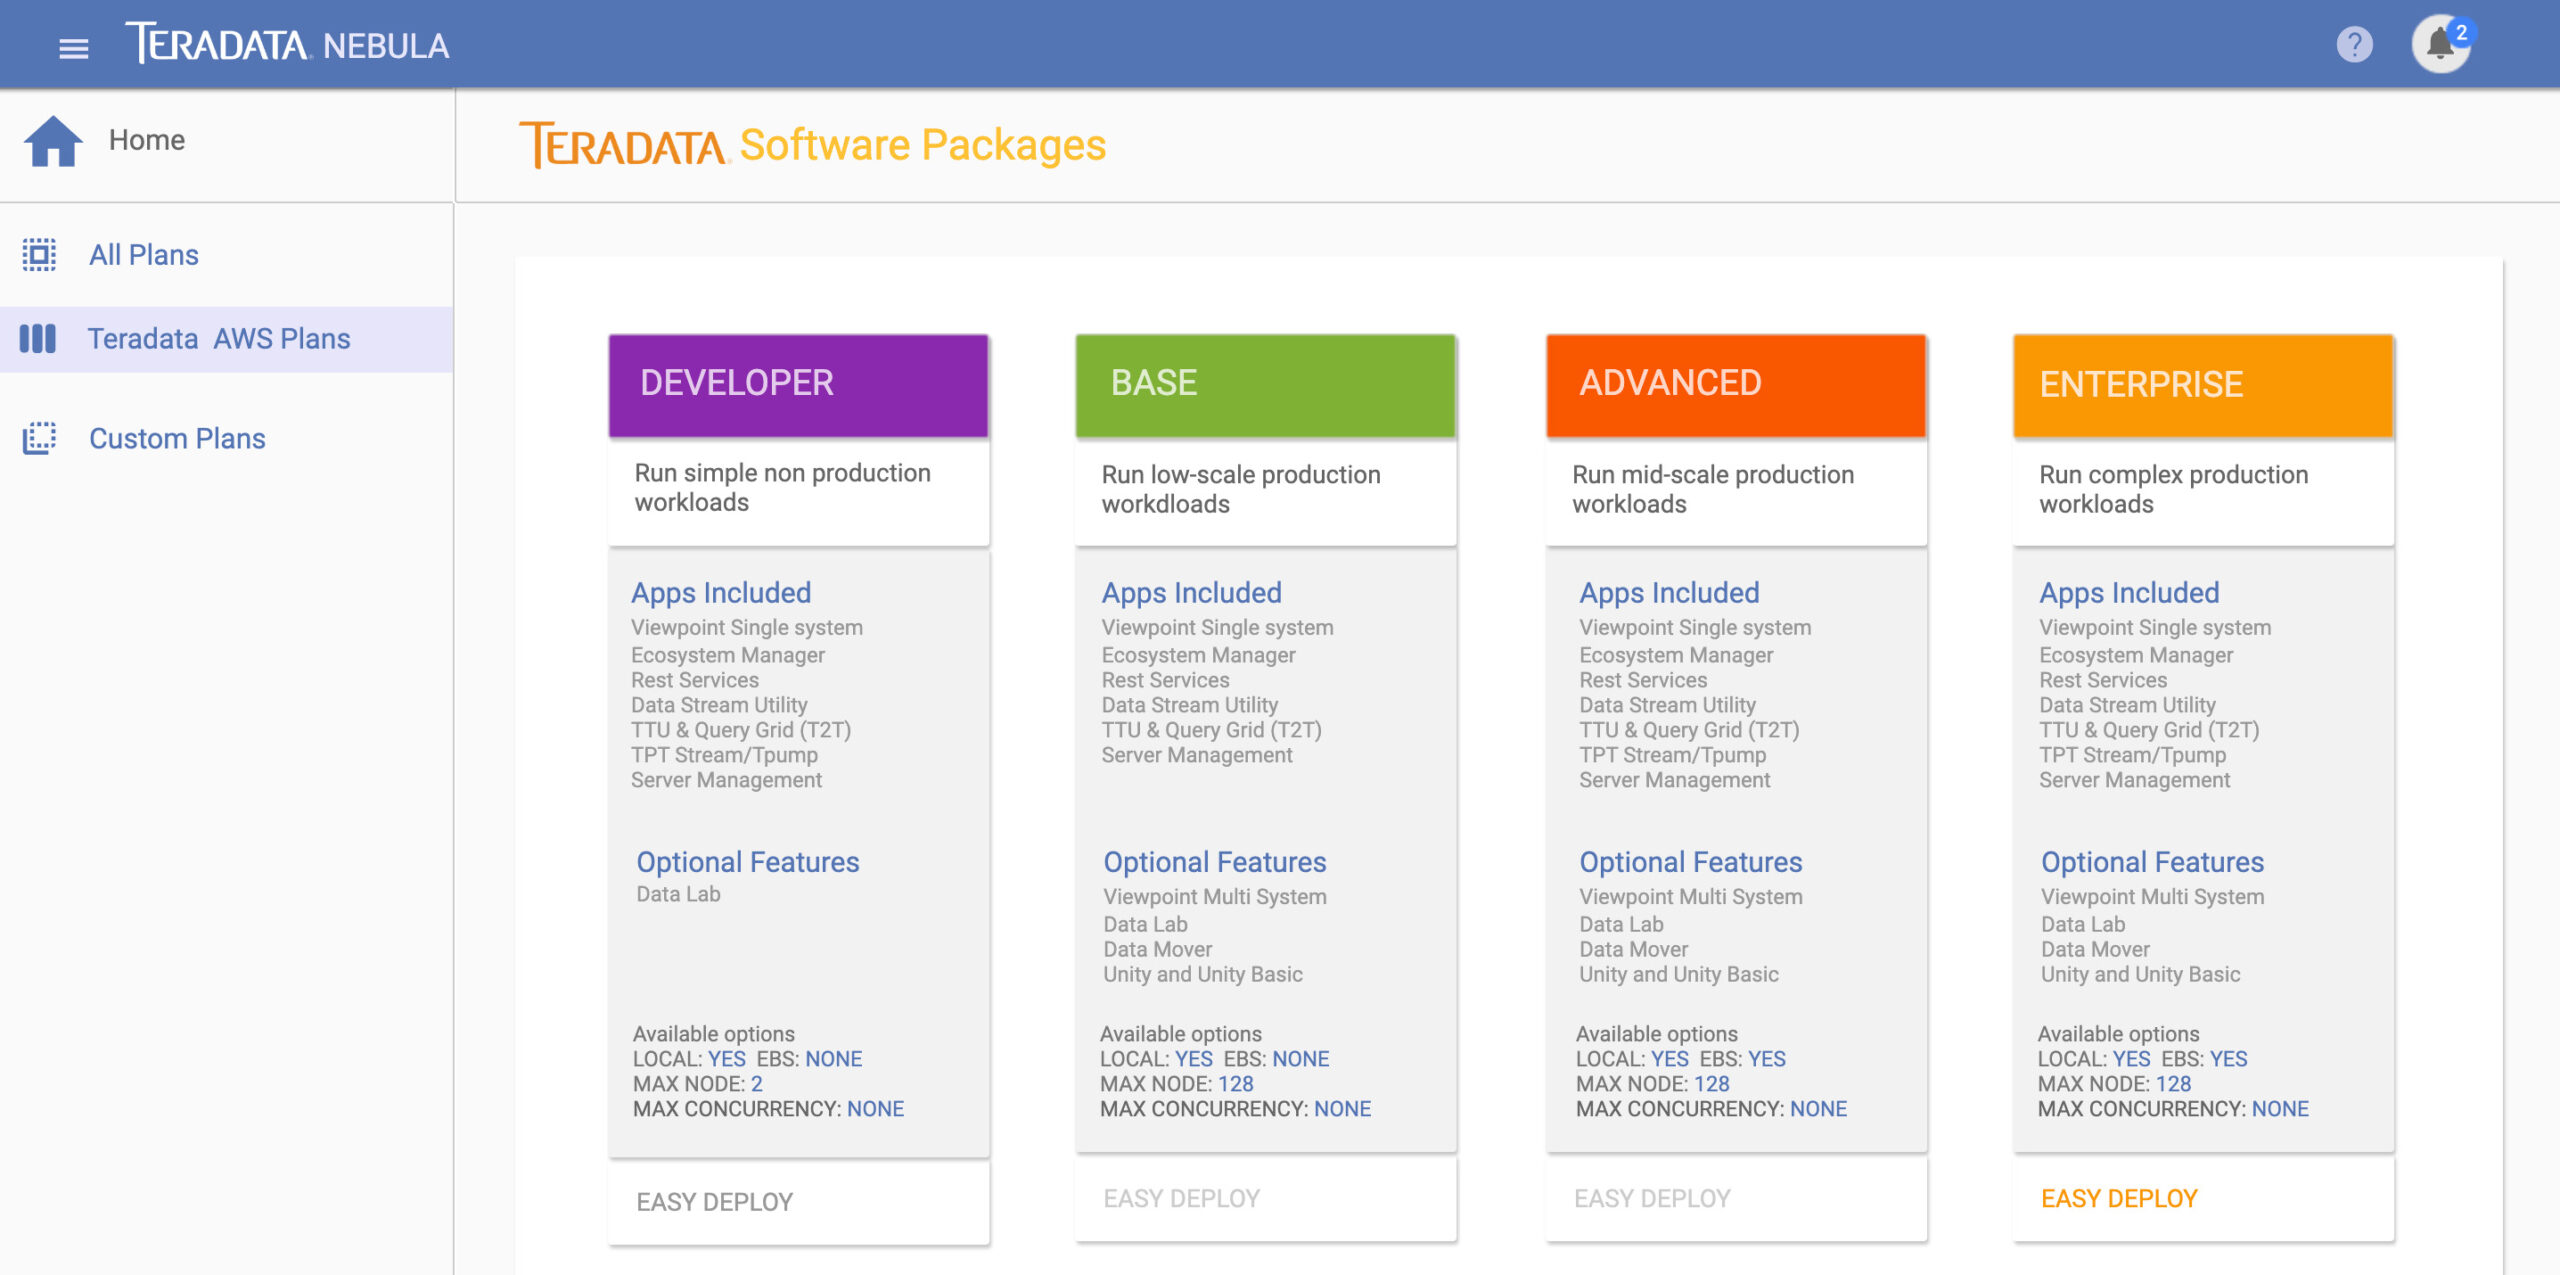
Holistic Approach: Adopted a multi-faceted strategy that encompassed market research, user-centric design, automated validation, and strategic road mapping.
-
User Focus: Prioritized user needs and expectations through comprehensive research and user-centric design principles, leading to a highly intuitive and effective platform.
-
Automated Validation: Implemented automated mechanisms for continuous security control validation, ensuring compliance with industry standards and user requirements.
-
Strategic Alignment: Crafted a strategic roadmap that served as the project’s blueprint, aligning all developmental activities with the company’s long-term goals.
-
Quality Assurance: Conducted rigorous usability testing and iterative enhancements to ensure the platform’s effectiveness and user experience met the highest standards.
Strategy:
Phase 1: Research & Planning
- Key Metrics: User interviews conducted, market analysis completion rate
- Learnings and Takeaway: Identified key user pain points and market gaps
- Optimization: Refined project scope based on research
- Visibility: Initial stakeholder meetings to align on objectives
- Iterations: Revised project plan based on initial feedback
- Next Steps: Move to design phase
Phase 2: Design & Prototyping
- Key Metrics: Number of prototypes, user testing completion rate
- Learnings and Takeaway: Understood what design elements resonate with users
- Optimization: Iterative design improvements
- Visibility: Regular design reviews with stakeholders
- Iterations: Multiple design iterations based on user feedback
- Next Steps: Move to development phase
Phase 3: Development
- Key Metrics: Code commits, feature completion rate
- Learnings and Takeaway: Gained insights into technical challenges and solutions
- Optimization: Code refactoring and performance tuning
- Visibility: Bi-weekly sprint reviews
- Iterations: Agile development cycles for incremental improvements
- Next Steps: Move to testing phase
Phase 4: Testing & Compliance
- Key Metrics: Test cases passed, compliance checklist completion
- Learnings and Takeaway: Identified areas for improvement and compliance gaps
- Optimization: Bug fixes and compliance adjustments
- Visibility: Full test and compliance reports to stakeholders
- Iterations: Re-testing after each set of fixes
- Next Steps: Move to deployment phase
Phase 5: Deployment & Launch
- Key Metrics: Deployment success rate, initial user adoption
- Learnings and Takeaway: Effectiveness of deployment strategy
- Optimization: Fine-tuning based on initial user feedback
- Visibility: Launch announcements and stakeholder briefings
- Iterations: Post-launch patches and updates
- Next Steps: Move to post-launch optimization and scaling
Phase 6: Post-Launch Optimization & Scaling
- Key Metrics: User engagement, retention rates
- Learnings and Takeaway: User behavior and areas for improvement
- Optimization: Feature updates and performance improvements
- Visibility: Ongoing reporting to stakeholders
- Iterations: Continuous improvement based on analytics and user feedback
- Next Steps: Plan for the next version or additional features
By strategically planning each phase, we were able to maintain a focused approach, adapt to challenges, and ultimately deliver a product that met both user needs and business objectives.
Key Metrics:
-
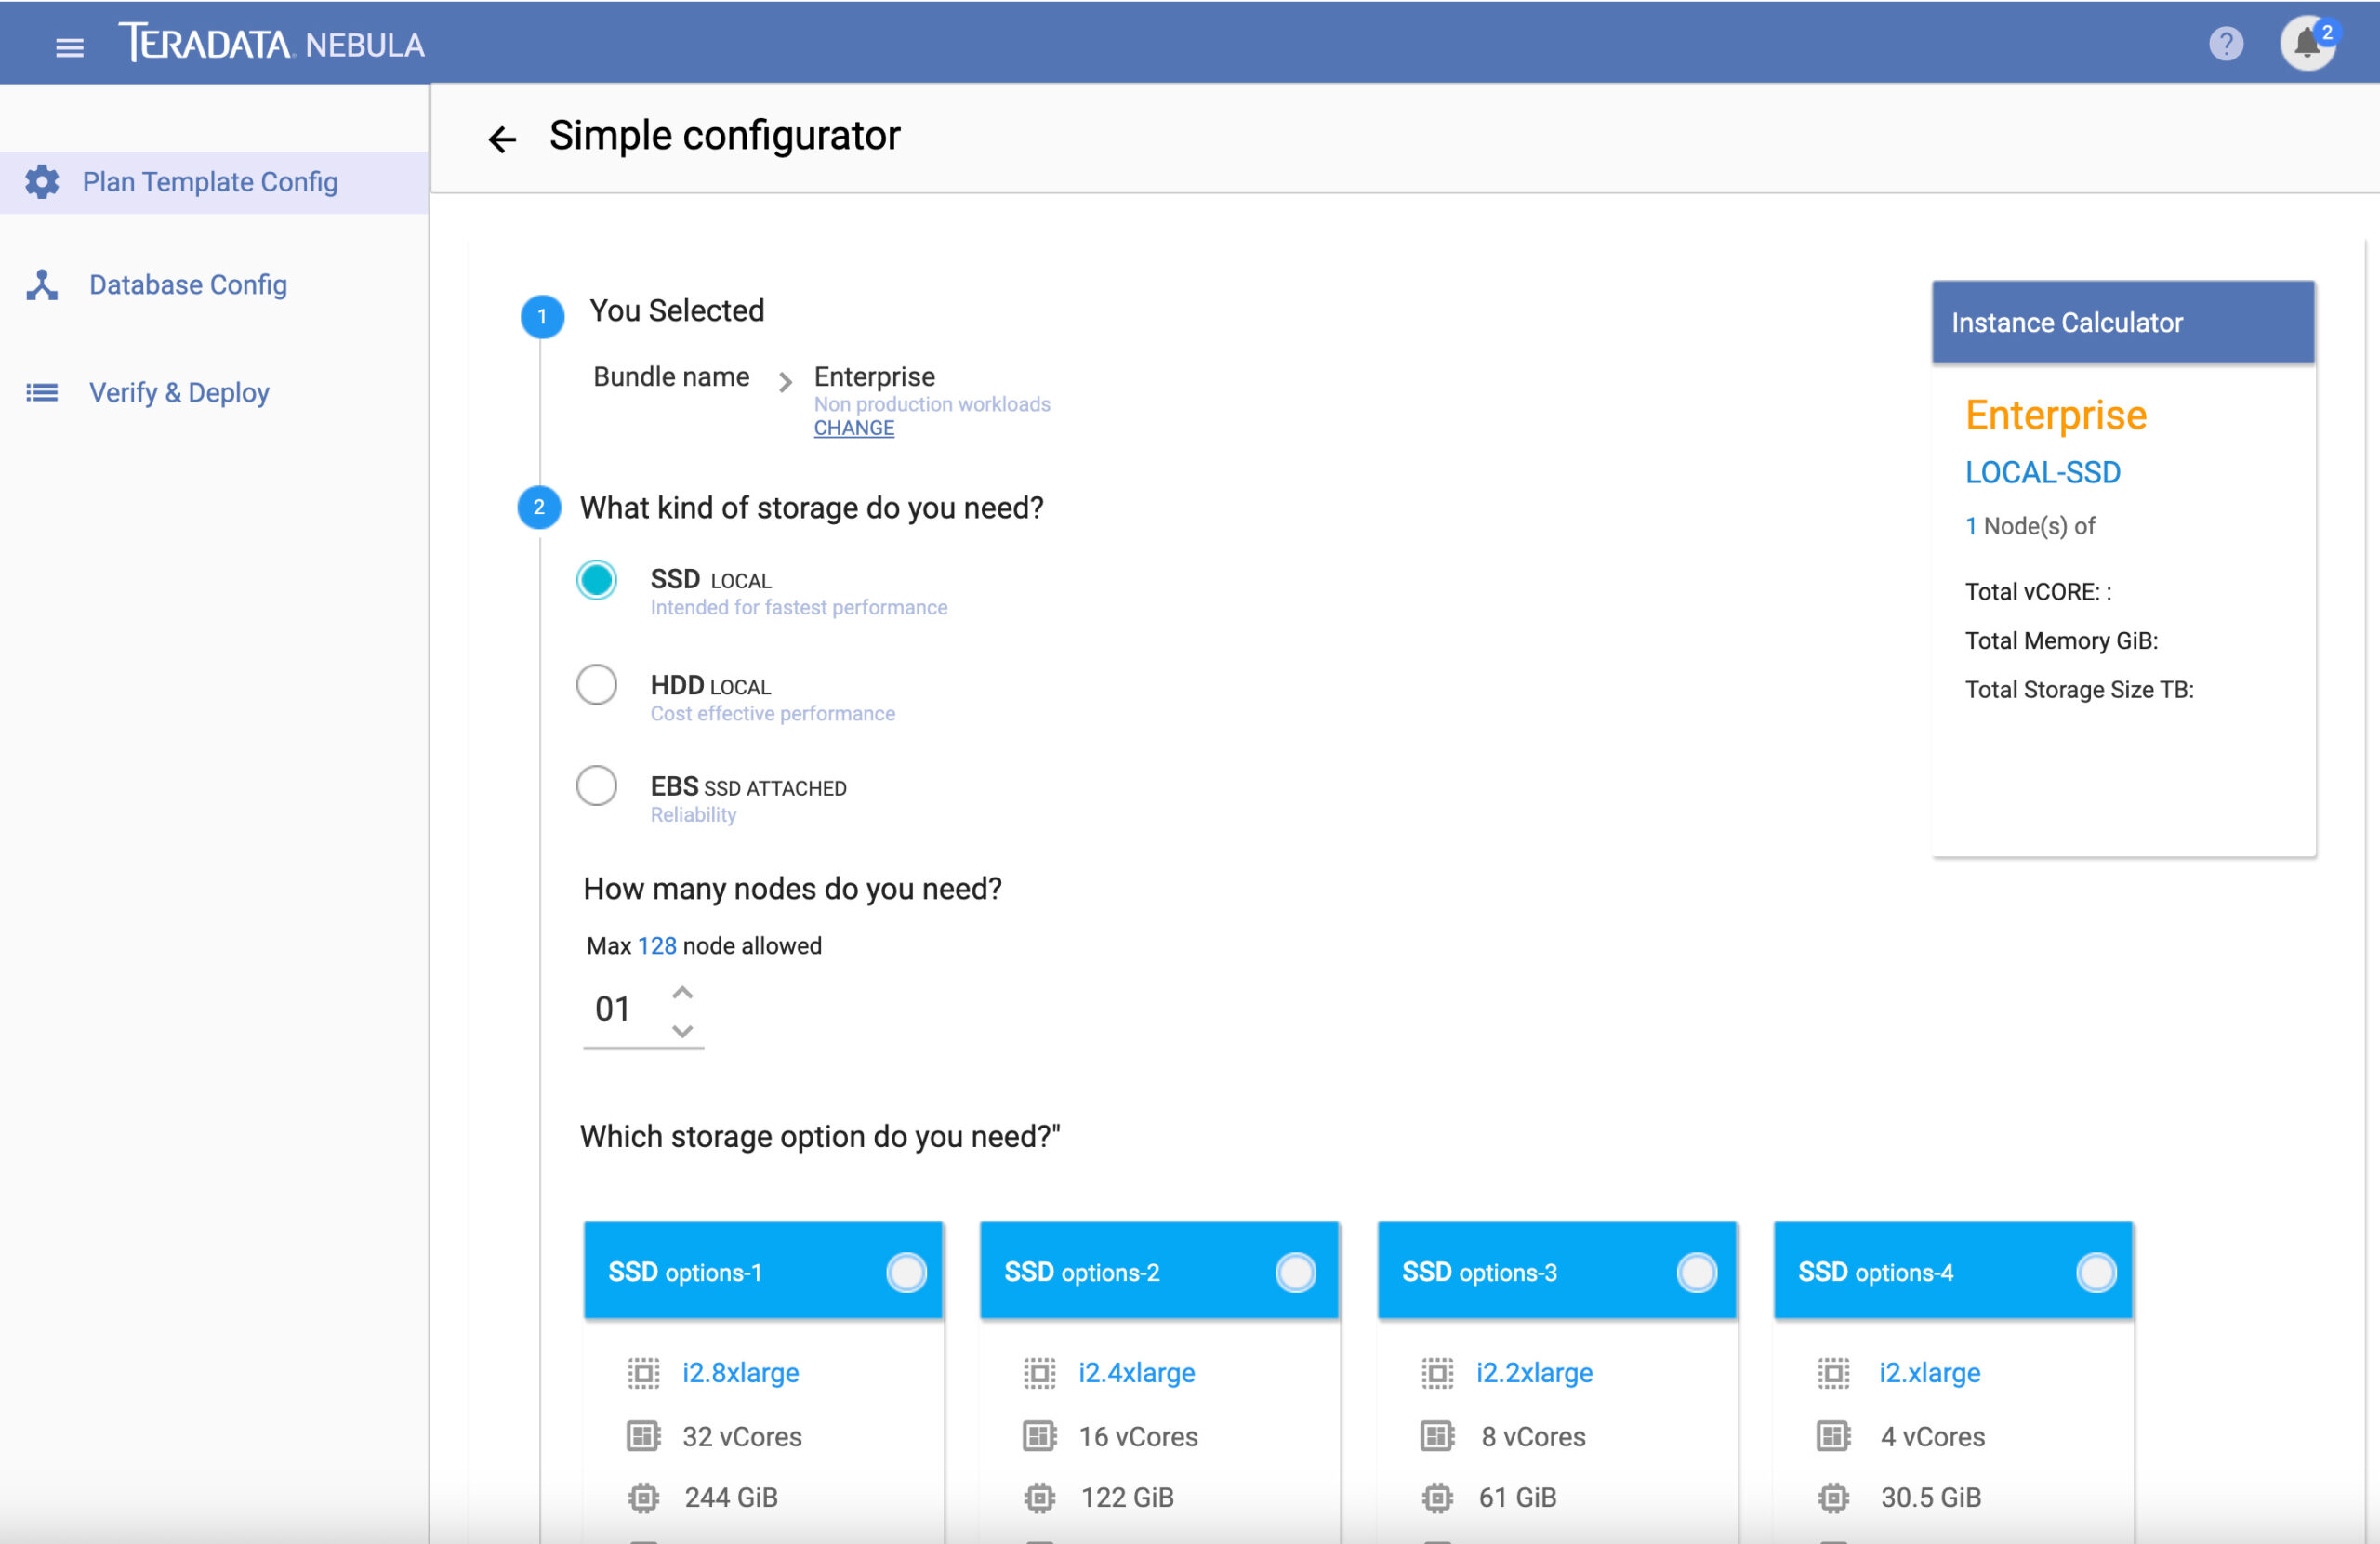
Sale of Deployments: This metric measures the number of Nebula deployments sold, providing a direct indicator of market demand and revenue generation.
-
Pre-Deployment Cost Estimation Accuracy: This tracks how closely the estimated costs before deployment match the actual costs, aiding in budget management and financial planning.
-
Deployment Folding/Unfolding Rate: This measures the frequency with which deployments are folded (paused or scaled down) or unfolded (resumed or scaled up), offering insights into resource utilization and operational flexibility.
-
Customer Lifetime Value (CLV): This calculates the total value a customer brings over the entire duration of their relationship with the product, helping in long-term revenue forecasting.
-
Customer Acquisition Cost (CAC): This measures the total cost to acquire a new customer, providing insights into the efficiency of sales and marketing efforts.
-
Time-to-Value (TTV): This measures the time it takes for a customer to realize value from the product after deployment, serving as an indicator of product effectiveness and customer satisfaction.
-
Net Promoter Score (NPS): This gauges customer satisfaction and loyalty by measuring the willingness of customers to recommend the product to others.
-
Churn Rate: This tracks the percentage of customers who stop using the product over a specific time frame, providing insights into customer retention and potential areas for improvement.
-
Average Revenue Per User (ARPU): This calculates the average revenue generated per user, helping to understand the profitability of the customer base.
-
Operational Uptime: This measures the percentage of time the service is operational, serving as an indicator of reliability and service quality.
These additional metrics provide a more comprehensive view of the project’s performance, from sales and revenue to customer satisfaction and operational efficiency. They are crucial for making informed decisions, optimizing strategies, and ensuring the project’s overall success.
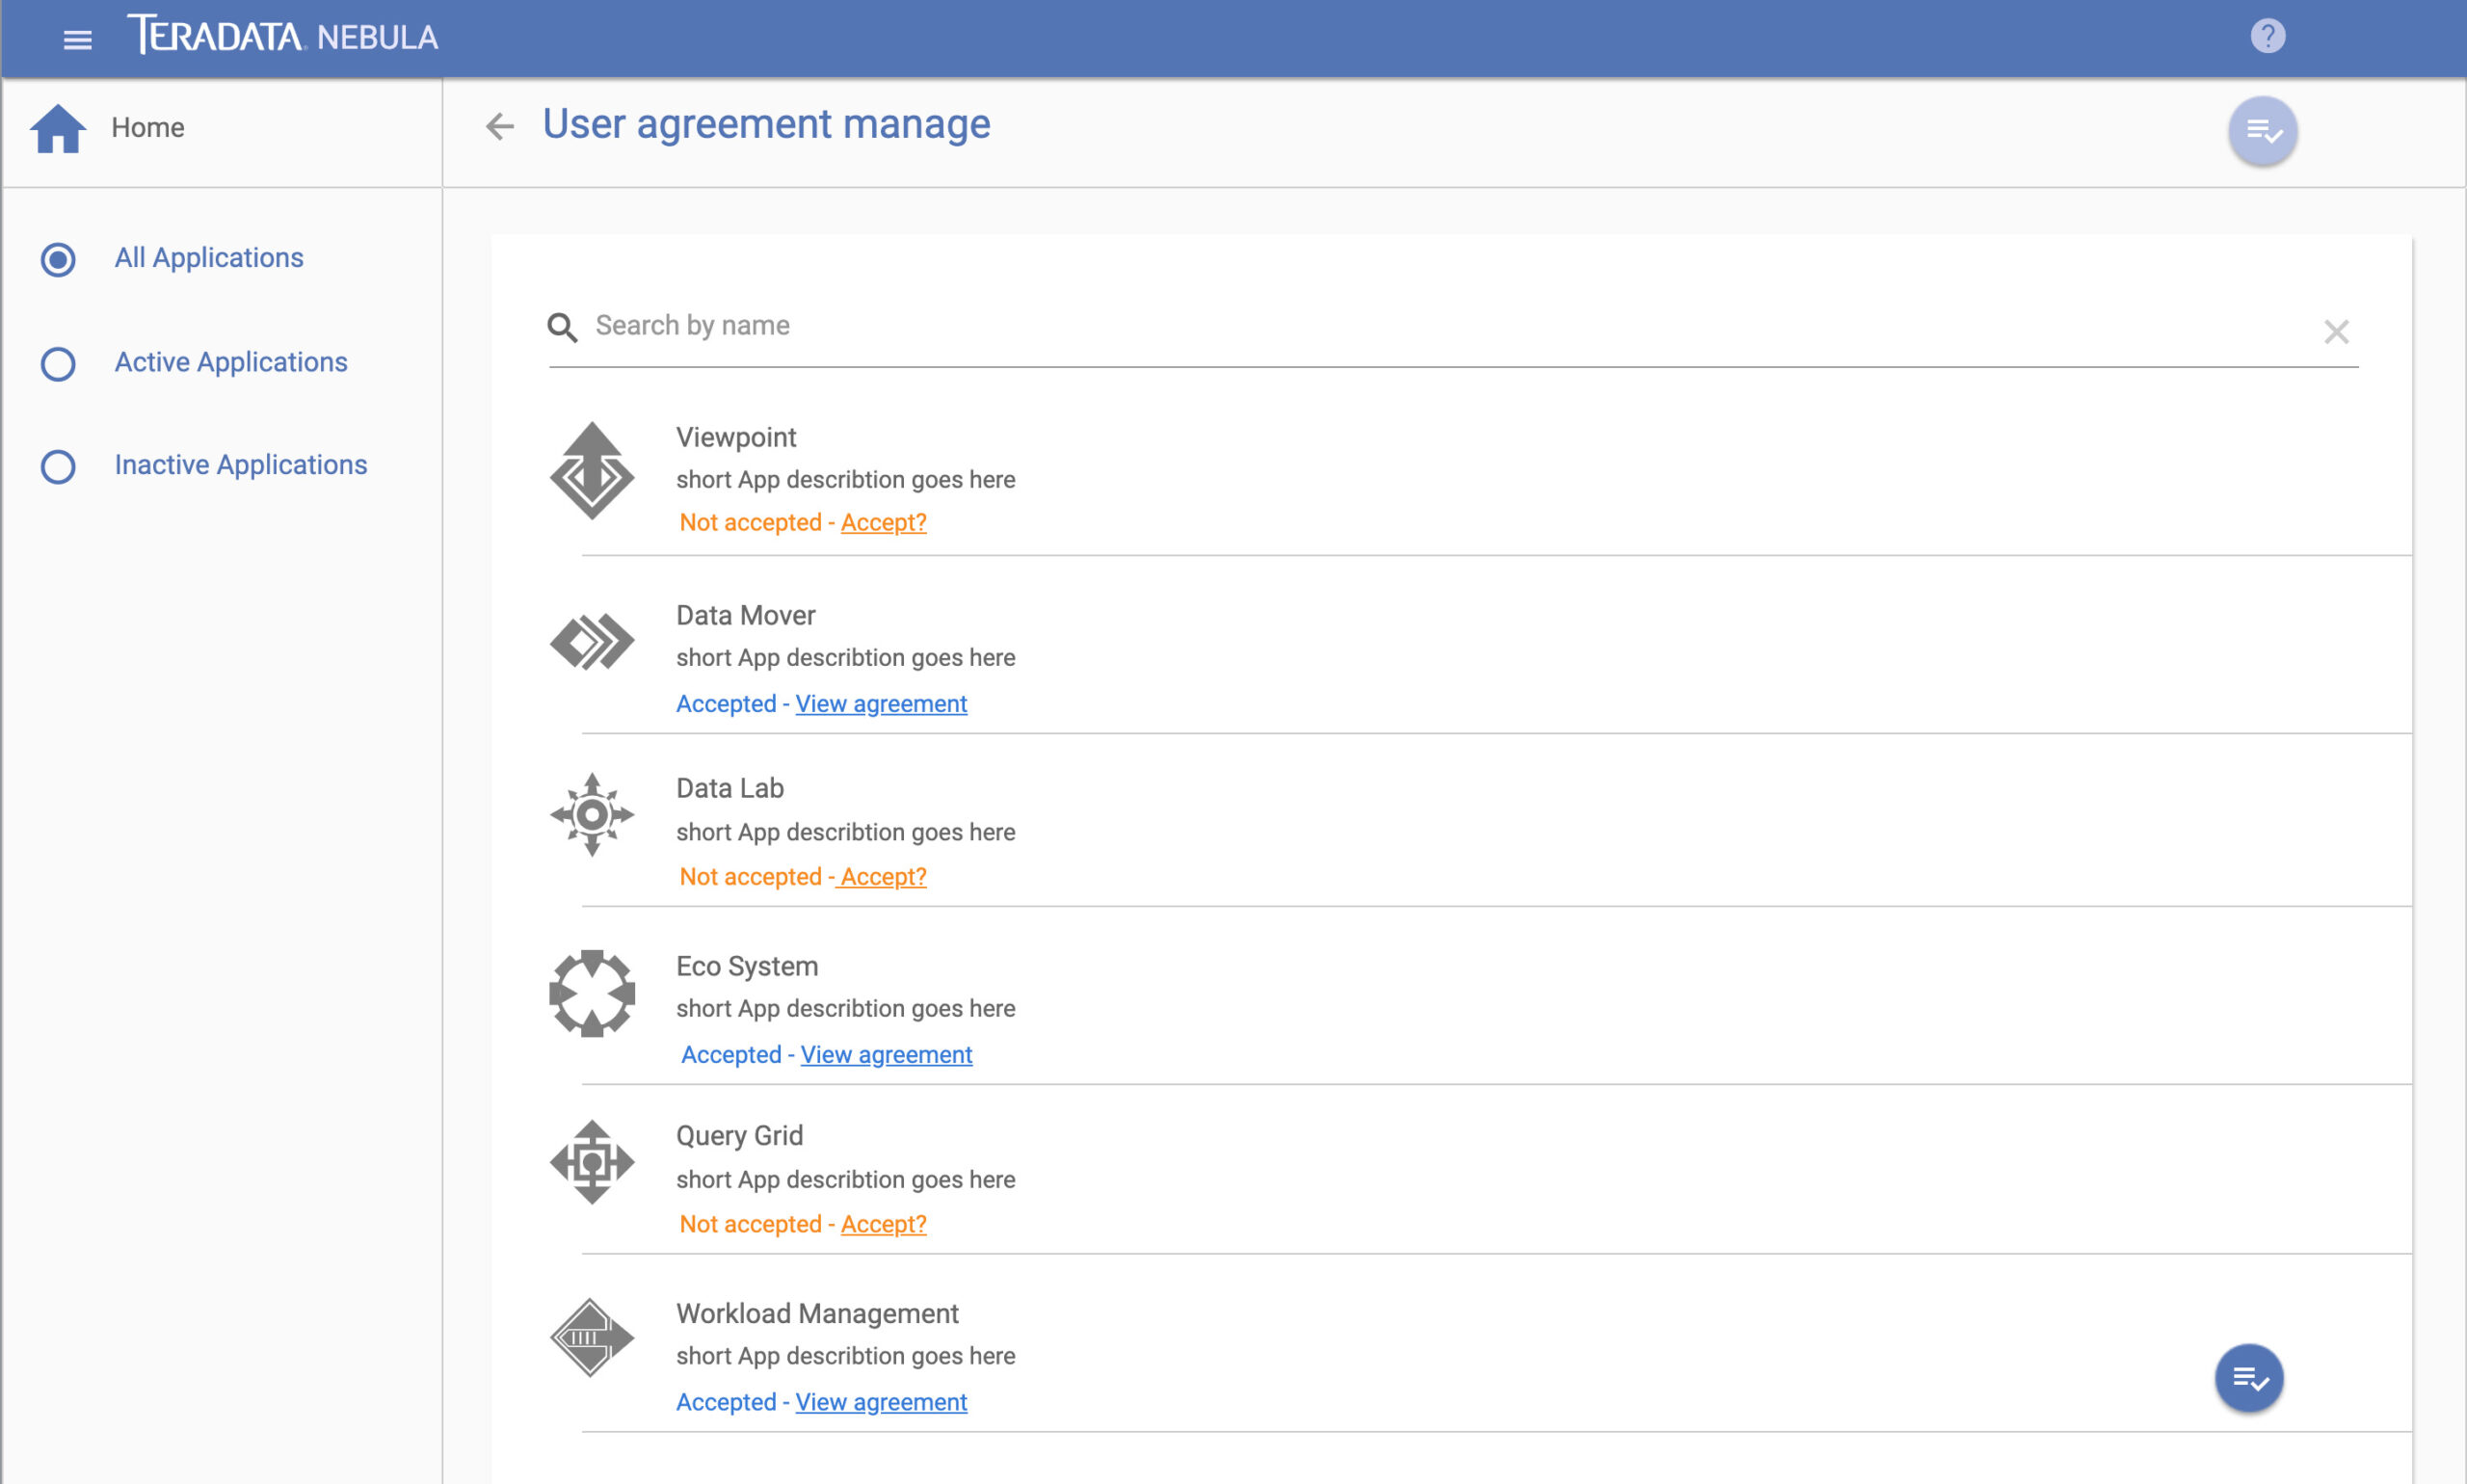
Key Learnings and Takeaways:
User-Centricity is Crucial: One of the most important learnings was the value of putting the user at the center of all decisions. This approach led to higher user satisfaction and engagement rates.
Accurate Cost Estimation Matters: Knowing the total cost before deploying was invaluable for budget management and setting client expectations, reducing financial risks.
Agility in Deployment: The ability to fold and unfold deployments provided operational flexibility, allowing for quick adjustments to meet changing needs and optimize resource utilization.
Compliance is Non-Negotiable: Meeting Amazon’s and Microsoft’s compliance standards was not just a legal necessity but also a competitive advantage in the market.
Collaboration is Key: Working closely with various stakeholders, from development teams to design agencies, enriched the project and accelerated its time-to-market.
Data-Driven Decision Making: Utilizing key metrics for performance evaluation helped in making informed decisions, optimizing strategies, and identifying areas for improvement.
Quality Assurance Pays Off: Rigorous testing ensured a high-quality end product, reducing post-launch issues and increasing customer satisfaction.
Customer Acquisition and Retention: Learning the balance between Customer Acquisition Cost (CAC) and Customer Lifetime Value (CLV) was crucial for sustainable growth.
Time-to-Value is a Selling Point: The quicker customers realized value from the product, the higher their satisfaction and loyalty, making Time-to-Value an important metric for success.
Continuous Improvement is Vital: The project reinforced the importance of an iterative approach and continuous feedback loops for ongoing improvement and adaptation to market needs.
Operational Uptime is a Trust Factor: Ensuring high levels of operational uptime not only improved service quality but also built trust with customers.
Revenue Metrics are Tied to User Experience: Metrics like Average Revenue Per User (ARPU) and Net Promoter Score (NPS) were closely tied to the quality of the user experience, emphasizing the ROI of good design and usability.
These learnings and takeaways have been instrumental in shaping the project’s success and will serve as valuable insights for future initiatives.
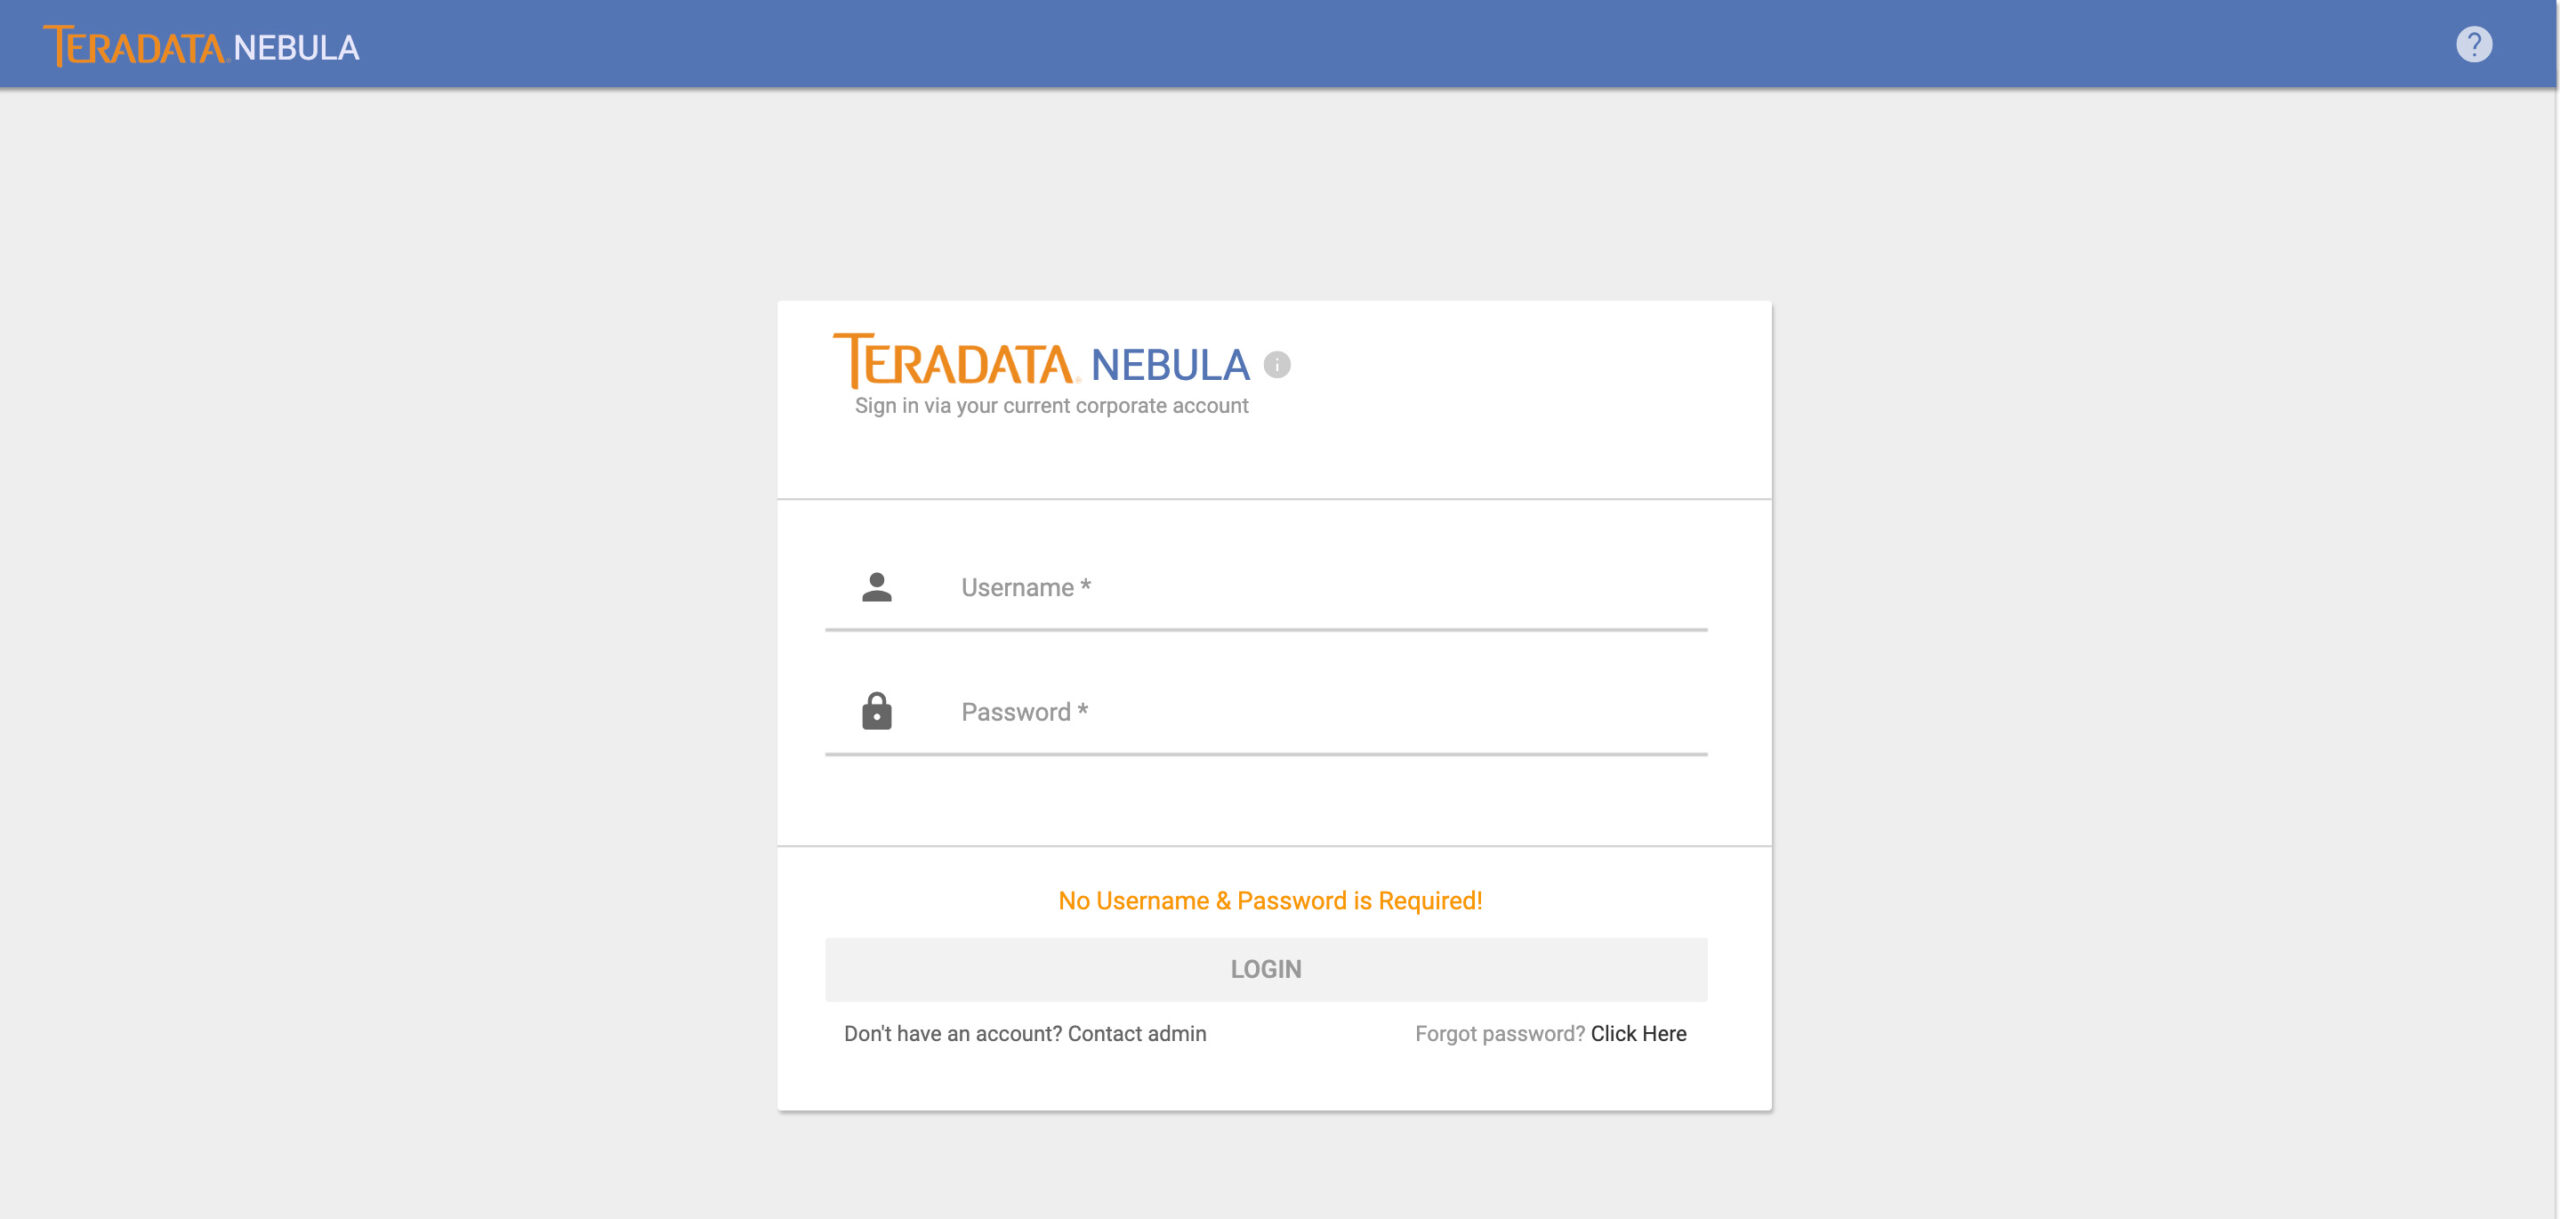
Optimization:
User Experience (UX) Tuning: Based on usability testing and customer feedback, make iterative improvements to the user interface and overall experience to increase user satisfaction and engagement.
Cost-Efficiency Analysis: Regularly review the accuracy of pre-deployment cost estimates and actual costs to identify areas for financial optimization. Implement strategies to reduce overhead without compromising quality.
Deployment Flexibility: Optimize the process of folding and unfolding deployments to make it more intuitive and less resource-intensive. This will allow for quicker adjustments to meet changing needs.
Compliance Automation: Introduce automated checks to ensure ongoing compliance with Amazon’s and Microsoft’s standards, reducing the manual workload and mitigating risks.
Collaborative Tools: Implement tools that facilitate better communication and collaboration among team members and stakeholders, streamlining the development process.
Data-Driven Insights: Use analytics and key performance indicators to identify bottlenecks or inefficiencies in the system. Implement changes based on these insights for performance optimization.
Quality Assurance (QA) Automation: Introduce automated testing to speed up the QA process, allowing for more frequent releases and quicker iterations.
Customer Retention Strategies: Based on the Customer Lifetime Value (CLV) and Churn Rate metrics, implement targeted marketing and customer service strategies to improve retention.
Time-to-Value Acceleration: Identify ways to help customers realize the value of the product more quickly, such as through onboarding improvements or feature enhancements.
Resource Allocation: Use operational uptime and other performance metrics to optimize server and resource allocation, ensuring maximum reliability and performance.
Revenue Optimization: Use Average Revenue Per User (ARPU) and Net Promoter Score (NPS) data to identify upsell or cross-sell opportunities, thereby increasing revenue.
Feedback Loop: Establish a robust system for collecting and analyzing user feedback for continuous improvement. Use this data to prioritize feature updates and bug fixes.
Next Steps:
User Experience Audit: Conduct a comprehensive UX audit to identify areas for improvement. Use the findings to inform the next round of design iterations.
Cost Analysis Review: Schedule a review meeting to discuss the accuracy of pre-deployment cost estimates and identify strategies for more accurate future estimates.
Deployment Flexibility Enhancement: Begin development on features that will make folding and unfolding deployments more streamlined and user-friendly.
Compliance Update: Stay updated with any changes in Amazon’s and Microsoft’s compliance standards and adjust the product accordingly.
Stakeholder Meeting: Organize a meeting with all key stakeholders to review current project status, key metrics, and learnings. Use this meeting to align everyone on the optimization strategies.
Data Analytics Report: Prepare a comprehensive report based on key performance indicators and analytics. Use this data to inform future optimization strategies.
QA Automation Implementation: Start the process of integrating automated testing tools into the QA workflow to speed up the testing process and improve reliability.
Customer Retention Plan: Develop and implement a customer retention plan based on insights from CLV and Churn Rate metrics.
Time-to-Value Study: Conduct a study to understand how quickly customers are realizing value from the product and use the findings to improve the onboarding process.
Resource Optimization: Perform a resource allocation review to ensure that server and other resources are being used efficiently.
Revenue Strategy Meeting: Schedule a meeting focused on revenue optimization strategies, using ARPU and NPS data to guide the discussion.
Feedback System Enhancement: Work on enhancing the existing feedback collection system to make it more robust and user-friendly.
Project Review and Roadmap Update: After implementing the initial optimization strategies, conduct a project review to assess their impact. Use the findings to update the project roadmap for the next quarters.
Team Training: Based on the new tools and processes being introduced, schedule training sessions for the team to ensure everyone is up to speed.
Public Communication: Prepare and release updates to customers and stakeholders about the new features, improvements, and future plans for the Teradata Nebula project.
By systematically following these next steps, the project can continue to evolve and improve, ensuring ongoing success and alignment with both user needs and business objectives.
